dataeval Bias Tutorial
A guide to running the dataeval bias tools via checkmaite.
NOTE: The
dataevalpackage can be used in the checkmaite framework for both image classification (IC) and object detection (OD) tasks. This tutorial will only cover the OD scenario.
What is dataeval?
The dataeval package analyzes datasets and models to give users the ability to train and test performant, unbiased, and reliable AI models and monitor data for impactful shifts to deployed models.
The tools demonstrated in this tutorial are a subset of the larger dataeval framework. They are specifically focused on identifying any biases or correlations present in a dataset. A common cause of poor model performance on unseen data is shortcut learning — where a model uses secondary or background information to make predictions — which is enabled or exacerbated by dataset sampling biases.
At a high-level, identifying biases and correlations in a dataset proceeds as follows:
- Compute correlational relationships between metadata factors and classes in a dataset
- Compute measurements for how uniformly sampled the metadata factors are over a dataset
- Use AI models to identify under-represented images. These are images which are only related to, at most, a small number of other images in the dataset
The dataeval bias-detection tools are generally applied to an entire dataset. Their computational demands are low-to-moderate, and are run on both CPU and GPU. (The AI models are run on GPU, but they can also be run on CPU if a GPU is not available.)
Overview and Background
This section will outline the aspects most relevant to applying the dataeval bias-detection tools to Object Detection problems similar to checkmaite's use case.
For more in-depth reading on the tool, visit the dataeval documentation
Computing correlational relationships
The balance function measures correlational relationships between metadata factors and classes by calculating the mutual information between the metadata factors and the class labels.
Overview
The information provided by the balance function may be visually understood with a heat map.
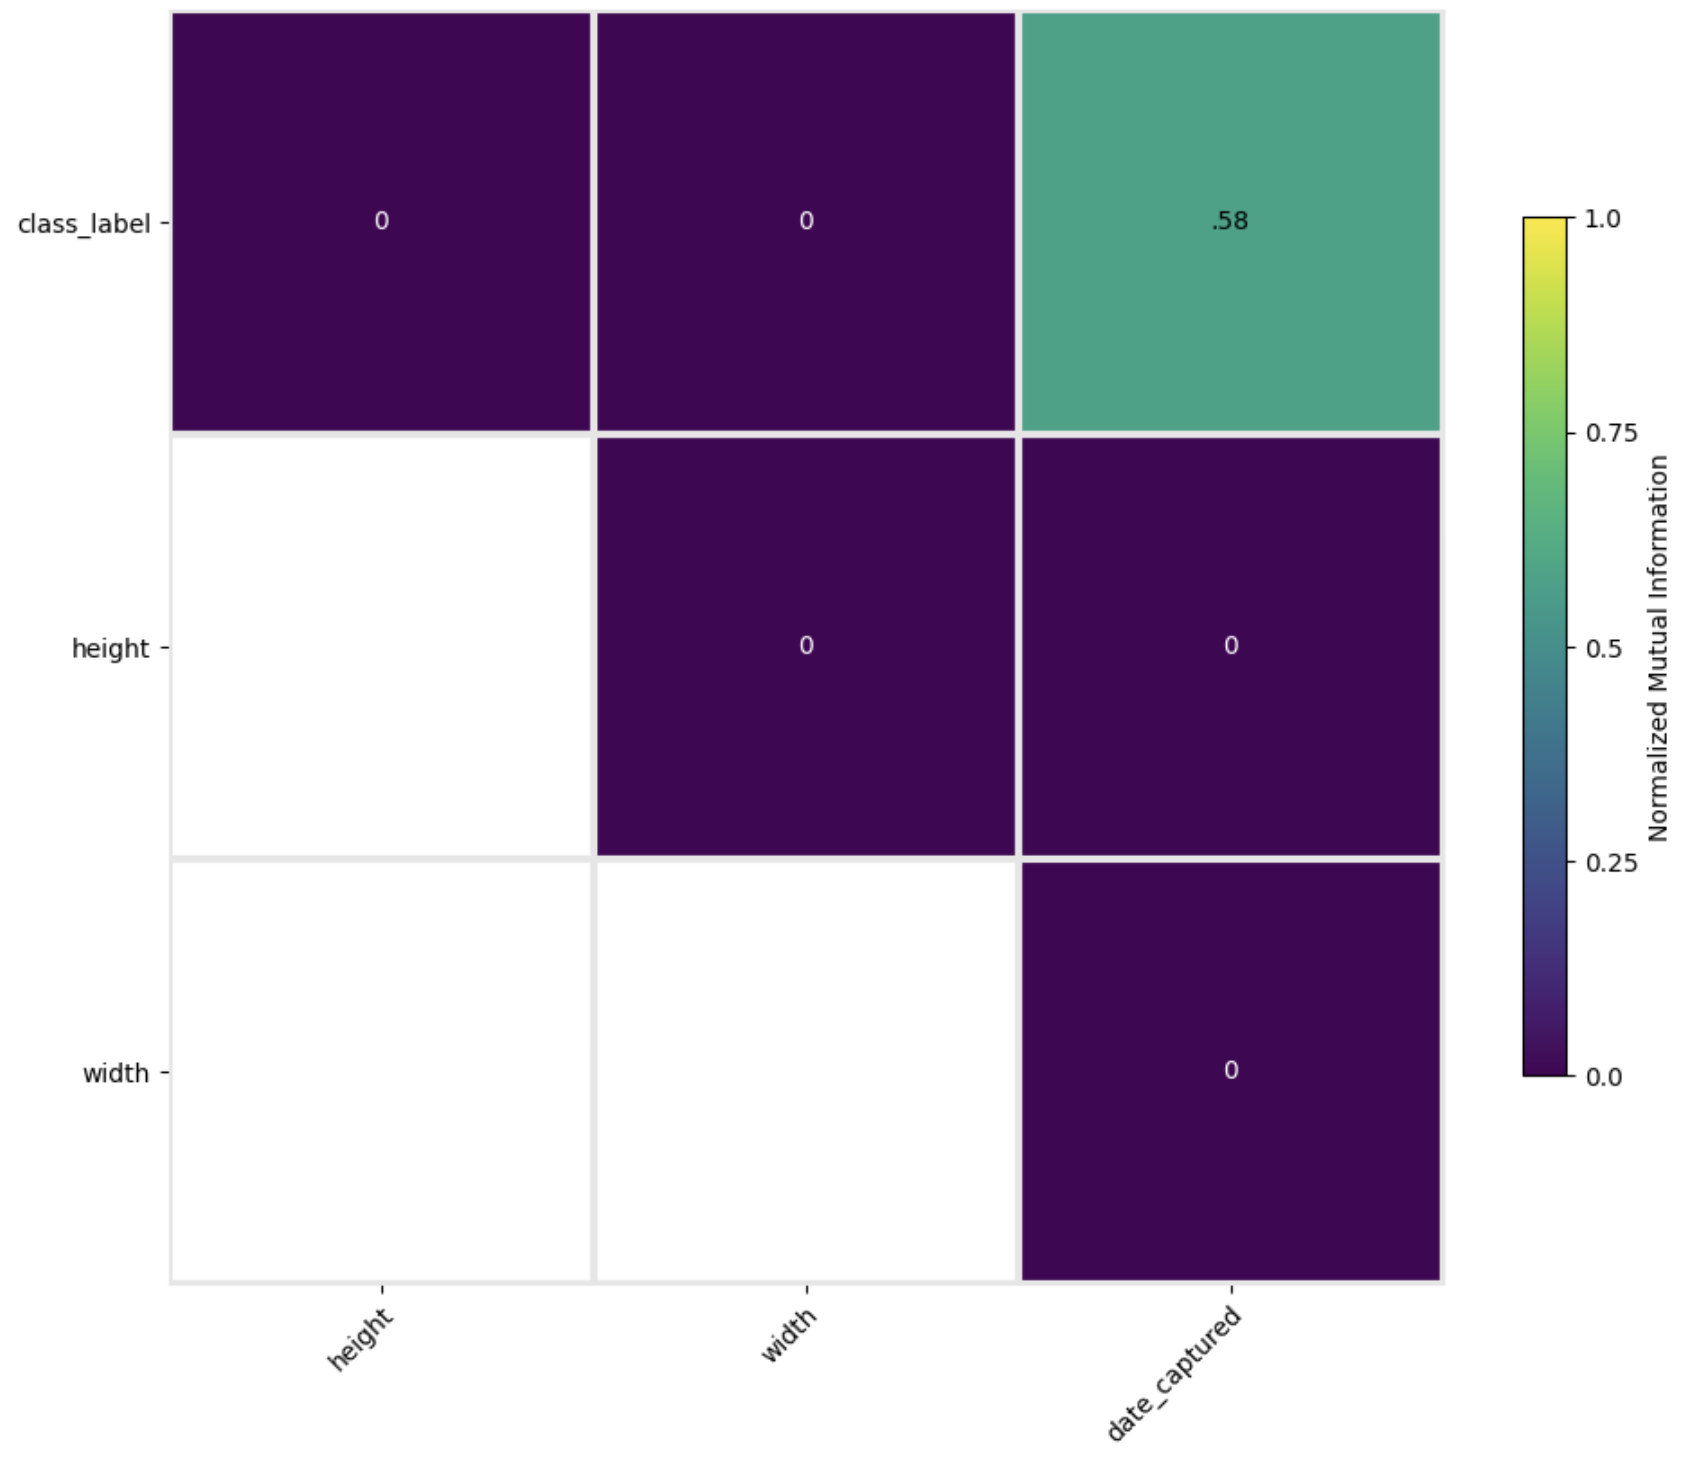
The heatmap shows the relationships between the different metadata factors and class labels. As a rule-of-thumb, values approaching or exceeding 0.5 should be further investigated to prevent a model from learning a potentially harmful shortcut. In the example above, we can see a relationship between class labels and the date of capture of an image.
The balance function can also analyze individual classes. This is useful for detecting relative class imbalance i.e. when one class is over-represented relative to most other classes. Such an imbalance can mean that a model might learn to bias towards a specific class. This can become a problem if an operational dataset does not have a similar imbalance.
Measuring dataset diversity
The diversity function measures the evenness or uniformity of the sampling of metadata factors over a dataset. Values near 1 indicate uniform sampling, while values near 0 indicate imbalanced sampling, e.g. all values taking a single value.
Overview
The information provided by the diversity function may be visually understood with a bar chart.
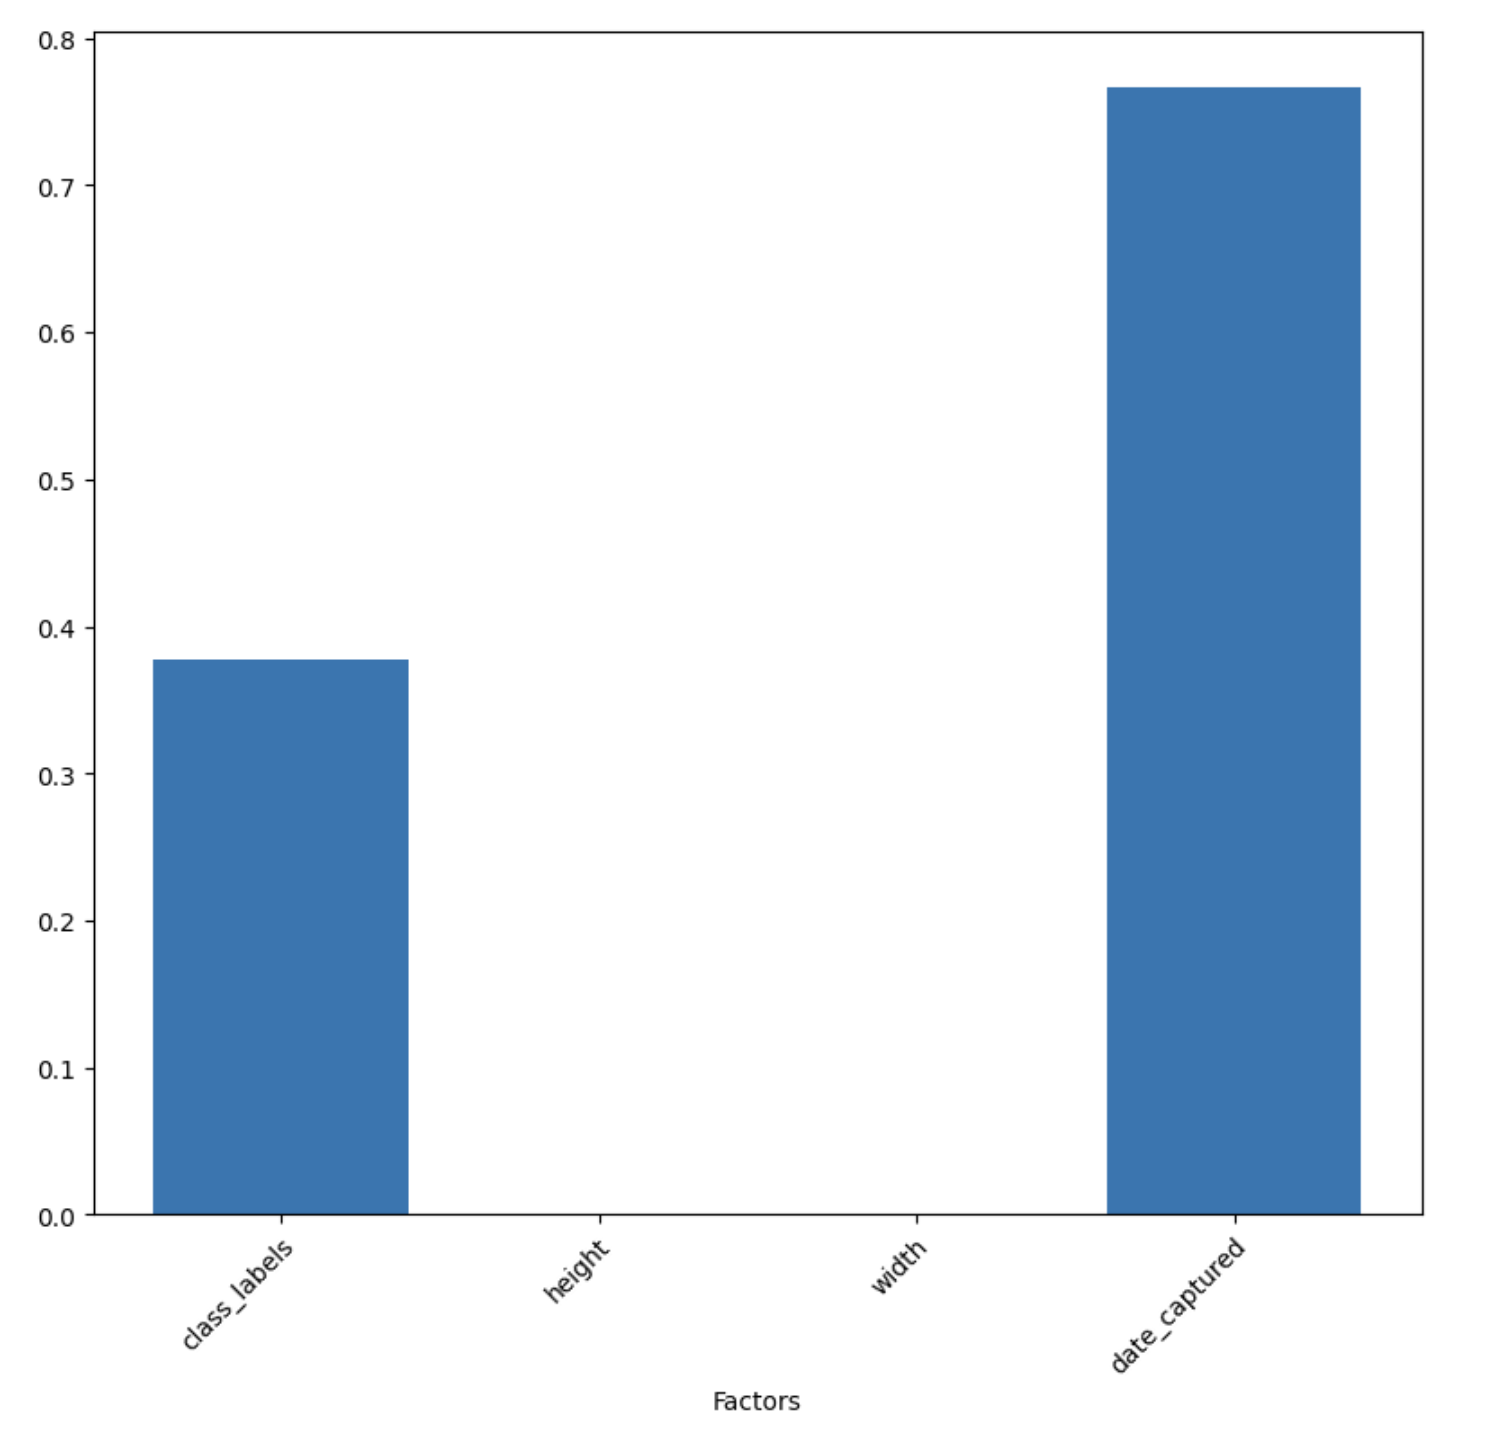
Factors with values near 1 contain relatively little or no bias. Factors with values less than 0.1 are so heavily imbalanced that it should be immediately obvious if there is a problem. In the above example, all images have the same size and so their diversity is 0 - this is not usually a problem and so can be ignored.
The categories of most interest are generally those that are between 0.1 and 0.4 because this region represents skewed value distributions for the factor. These factors contain bias that should be addressed either by adding or removing data to even out the sampling. For instance, in the above example the class_labels factor highlights that there is unevenness in the number of data points per class.
Measuring dataset coverage
Coverage determines how many other images in a dataset are closely related to an image. If there are few other images that are closely related to an image, the image is said to be under-represented. The results of the coverage analysis are usually presented in a tabular format, and include information on whether or not an image is under-represented.

Running the dataeval bias detection algorithms inside checkmaite
The following section uses the checkmaite API to run the dataeval bias test stage for Object Detection.
First, we create the the necessary MAITE-wrapped dataset. We use the CocoDetectionDataset wrapper. The data is found in our test directory.
from pathlib import Path

from checkmaite.core.object_detection.dataset_loaders import CocoDetectionDataset

BASE_DIR = Path.cwd().parents[1]
dataset_root_path = BASE_DIR / "tests/data_for_tests/coco_resized_val2017"
dataset_ann_file_path = BASE_DIR / "tests/data_for_tests/coco_resized_val2017/instances_val2017_resized_6.json"

print("Loading example COCO dataset...")
dataset = CocoDetectionDataset(root=dataset_root_path, ann_file=dataset_ann_file_path, dataset_id="coco-example")
print(f"Dataset loaded with {len(dataset)} images")
Loading example COCO dataset...
Dataset loaded with 6 images
/home/runner/work/checkmaite/checkmaite/.venv/lib/python3.10/site-packages/xaitk_saliency/__init__.py:3: UserWarning: pkg_resources is deprecated as an API. See https://setuptools.pypa.io/en/latest/pkg_resources.html. The pkg_resources package is slated for removal as early as 2025-11-30. Refrain from using this package or pin to Setuptools<81.
  import pkg_resources
Next, we initialize an DatasetBiasTestStage object, load the dataset wrapped above, and execute the test stage.
from checkmaite.core.object_detection import DataevalBias, DataevalBiasConfig

# we exclude certain metadata fields from the analysis as they are determined to be irrelevant to the bias calculations

bias_config = DataevalBiasConfig(metadata_to_exclude=["license", "file_name", "coco_url", "flickr_url", "id"])

capability = DataevalBias()
output = capability.run(use_cache=False, datasets=[dataset], config=bias_config)


Slide Deck
Once the test stage has completed, the code below uses the gradient package to create HTML and PPTX formatted reports of the results of the dataeval bias test stage.
import os

from checkmaite.core.report._markdown import create_markdown_output

output_dir = Path("dataeval_bias_example_output")
os.makedirs(output_dir, exist_ok=True)

create_markdown_output(output.collect_md_report(threshold=0), output_dir, md_filename="Dataeval_Bias_Example_Report.md")
print(f"Markdown report saved in {output_dir}.")
Markdown report saved in dataeval_bias_example_output.